Channel Spectrogram
Channel Spectrogram
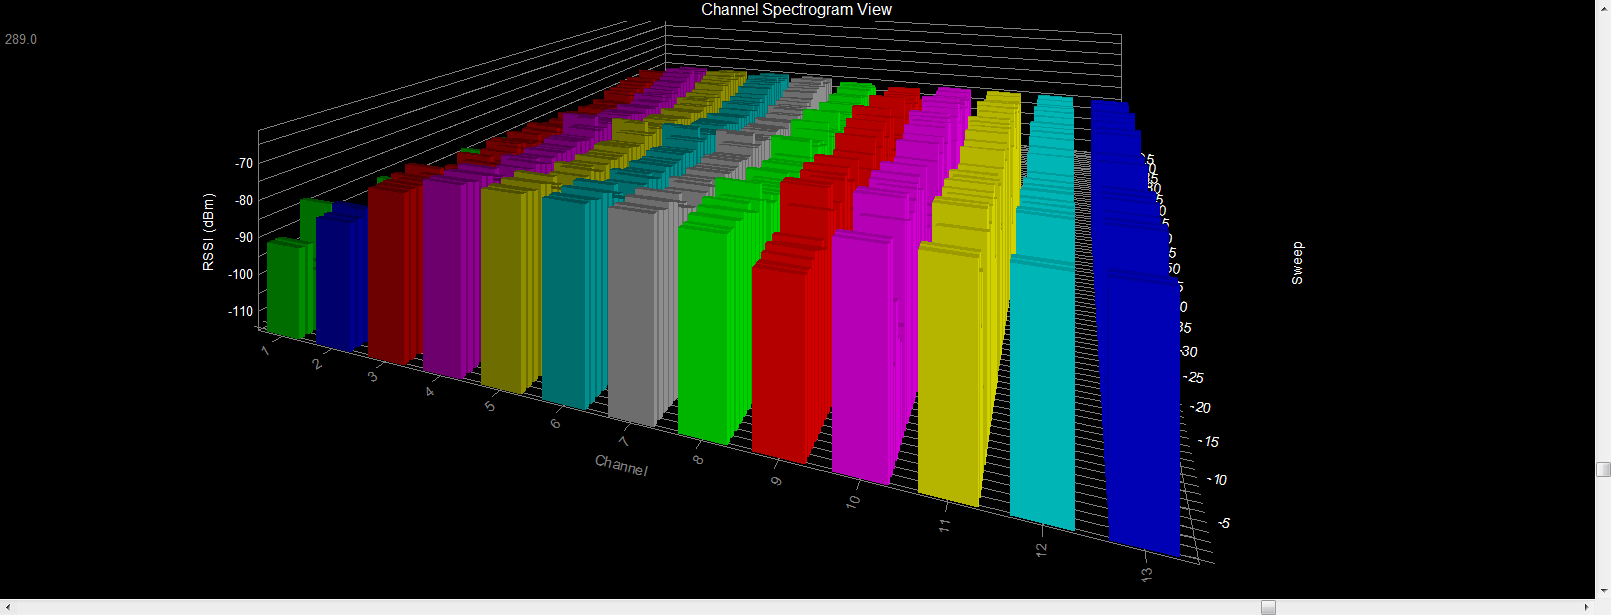
A “channel-centric” chart — displays a three-dimensional plot of channels as a function of time. Each channel is represented by its own set of bar graphs — the Z-axis is time and the Y-axis is signal strength. As with the Channel Timecourse chart (below), this view makes it easy to visualize how RF interference affects different channels over time. For “channel-centric” charts, the signal strengths of all frequencies used by a particular channel are summed, normalized and reported as one value.