Introduction
ClearWaves RF Spectrum Analyzer & Frequency Coordination Software
Precise, Wideband RF Spectrum Scanning, Visualization and Intermodulation Analysis
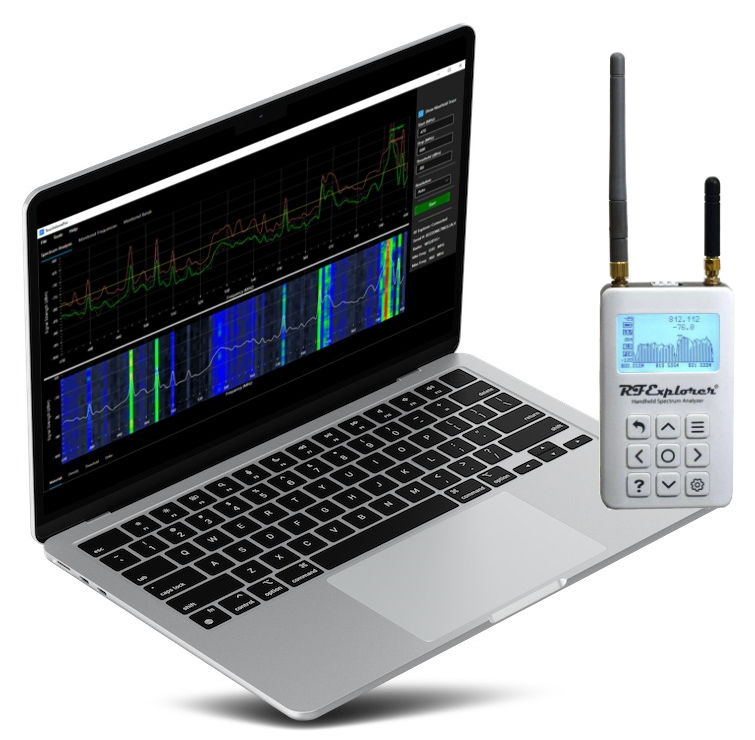
ClearWaves is a diagnostic software tool for the RF Explorer device -- specifically designed for the wireless professional audio field. In addition to running as a standalone, handheld device, RF Explorer can be connected to a PC where software provides enhanced functionality and data analysis. ClearWaves is the industry's first, PC-based tool to offer RF spectrum analysis, intermodulation analysis and automatic charting of open white space for use with wireless microphones, in-ear monitors, remote control, security, access control, etc. -- all built into a single product. ClearWaves' unique combination of features -- RF spectrum analysis plus intermodulation analysis -- make it an extremely versatile and powerful tool, one that extends beyond the bounds of traditional RF analyzers.
ClearWaves turns data collected from RF Explorer spectrum analyzers into graphical charts and displays in real time, enabling users to more readily visualize the RF environment, monitor RF signals, troubleshoot RF issues, and detect sources of RF interference. Intermodulation analysis generates Smart Frequency Sets for use in frequency coordination -- assigning the most reliable frequencies to your wireless audio gear.
ClearWaves offers a variety of diagnostic views of the data captured by the RF Explorer device. Employing multiple views of the data enhances your ability to gain a better understanding of the local, RF landscape. Furthermore, ClearWaves' intermodulation analysis sets itself apart from all other diagnostic software by generating and monitoring Smart Frequency Sets. A Smart Frequency Set is used for frequency coordination and assigning the most reliable frequencies to your wireless audio gear.
Spectrum Trace View
Continuously scans and samples the signal strength (dBm) of frequencies in the range the user has specified. In the 'Spectrum Trace' view the signal strength data (in dBm) is displayed as a function of frequency. Both LoRes and HiRes views are available.
Waterfall History
Provides a color-based visualization of the RF level and activity over time. As signal levels for specific frequencies or frequency ranges increase and decrease, the waterfall map varies its colors. This feature provides a quick glance back into the sweep history to identify aberrations or fluctuation in frequency levels.
Density Map
Displays accumulated RF energy as a function of frequency. The power of the signal strength in dBm is shown across the frequency span. Over time, this spectral view will approximate the steady-state RF energy signature of a given environment.
Threshold Trace
Highlights those frequencies whose signal strength exceeds a user-defined threshold. This feature is especially useful for visually emphasizing strong signals (and deemphasizing weak ones), where the user gets to define 'strong' and 'weak' according to where they set the threshold.
Delta Trace
Used to view small (or large) changes in the RF spectrum over time. Plotting the data in this way makes it easy to detect RF changes that occurred since the initial 'snapshot'.
Reference Trace
Similar to 'Delta Trace', used to view changes in the RF spectrum compared to a user-supplied 'Reference' trace. Plotting the data in this way makes it easy to detect RF changes that differ from the Reference trace.
Monitored Frequencies
Monitor specific frequencies over time and highlight occurrences where signal strength exceeds a user-defined threshold.
Monitored Bands
Monitor specific bands over time and highlight occurrences where signal strength exceeds a user-defined threshold.
Intermodulation Analysis
Generates and monitors Smart Frequency Set used for frequency coordination and assigning the most reliable frequencies to your audio gear.