Threshold Trace
Threshold Trace
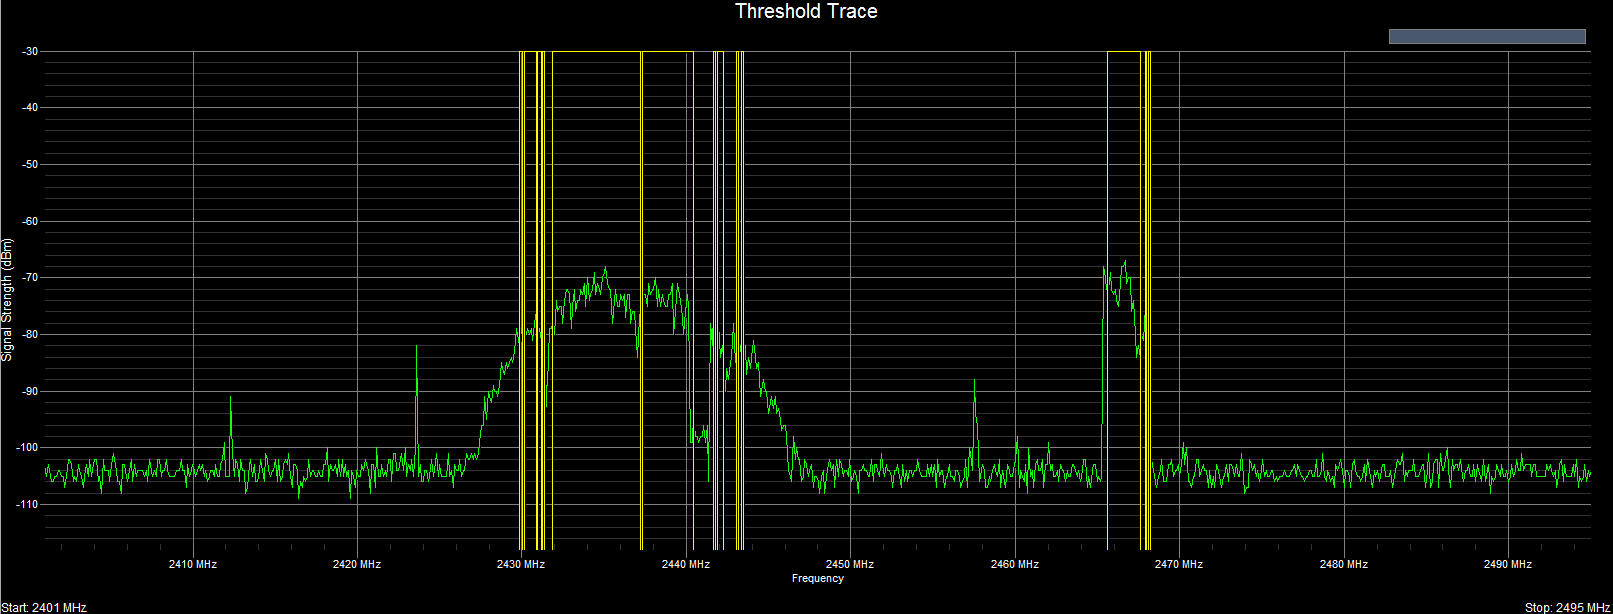
Similar to the Spectrum Trace view — used to monitor and display RF signal transmissions as a function of frequency. However, in addition, this chart highlights with a yellow box those frequencies whose signal strength exceeds a user-defined threshold. This feature is especially useful for visually emphasizing strong signals (and deemphasizing weak ones), where the user gets to define ‘strong’ and ‘weak’ according to where they set the threshold.