Introduction
Touchstone
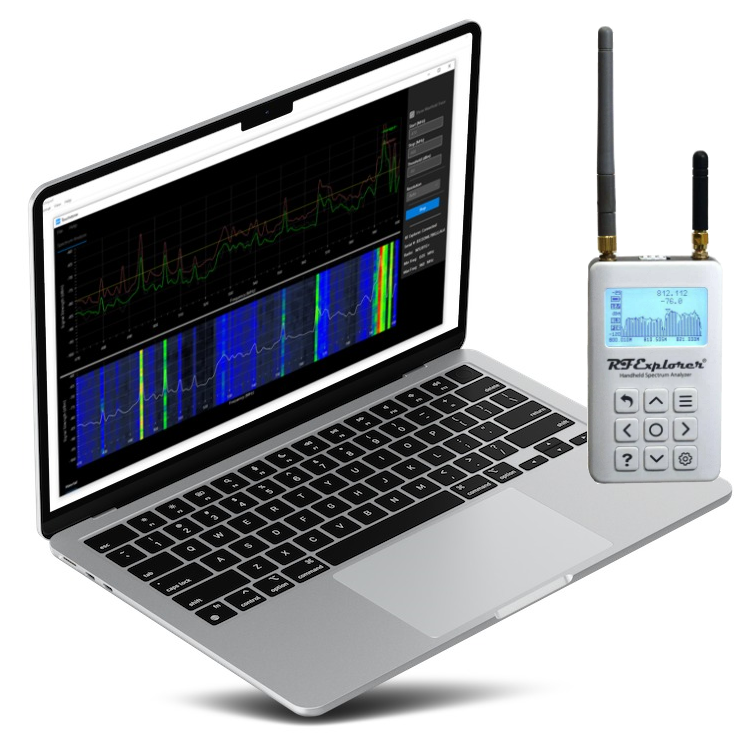
RF Spectrum Analyzer Software for RF Explorer
Touchstone software turns data collected from RF Explorer spectrum analyzers into graphical charts and displays in real time, enabling users to more readily visualize the RF environment, monitor RF signals, troubleshoot RF issues, and detect sources of RF interference. In addition to running as a standalone, handheld device, RF Explorer can be connected to a PC where software provides enhanced functionality and data analysis.
Touchstone offers diagnostic views of the data captured by the RF Explorer device. Employing multiple views of the data enhances your ability to gain a better understanding of the local, RF landscape.
Spectrum Trace View
Continuously scans and samples the signal strength (dBm) of frequencies in the range the user has specified. In the 'Spectrum Trace' view the signal strength data (in dBm) is displayed as a function of frequency. Both LoRes and HiRes views are available.
Waterfall History
Provides a color-based visualization of the RF level and activity over time. As signal levels for specific frequencies or frequency ranges increase and decrease, the waterfall map varies its colors. This feature provides a quick glance back into the sweep history to identify aberrations or fluctuation in frequency levels.