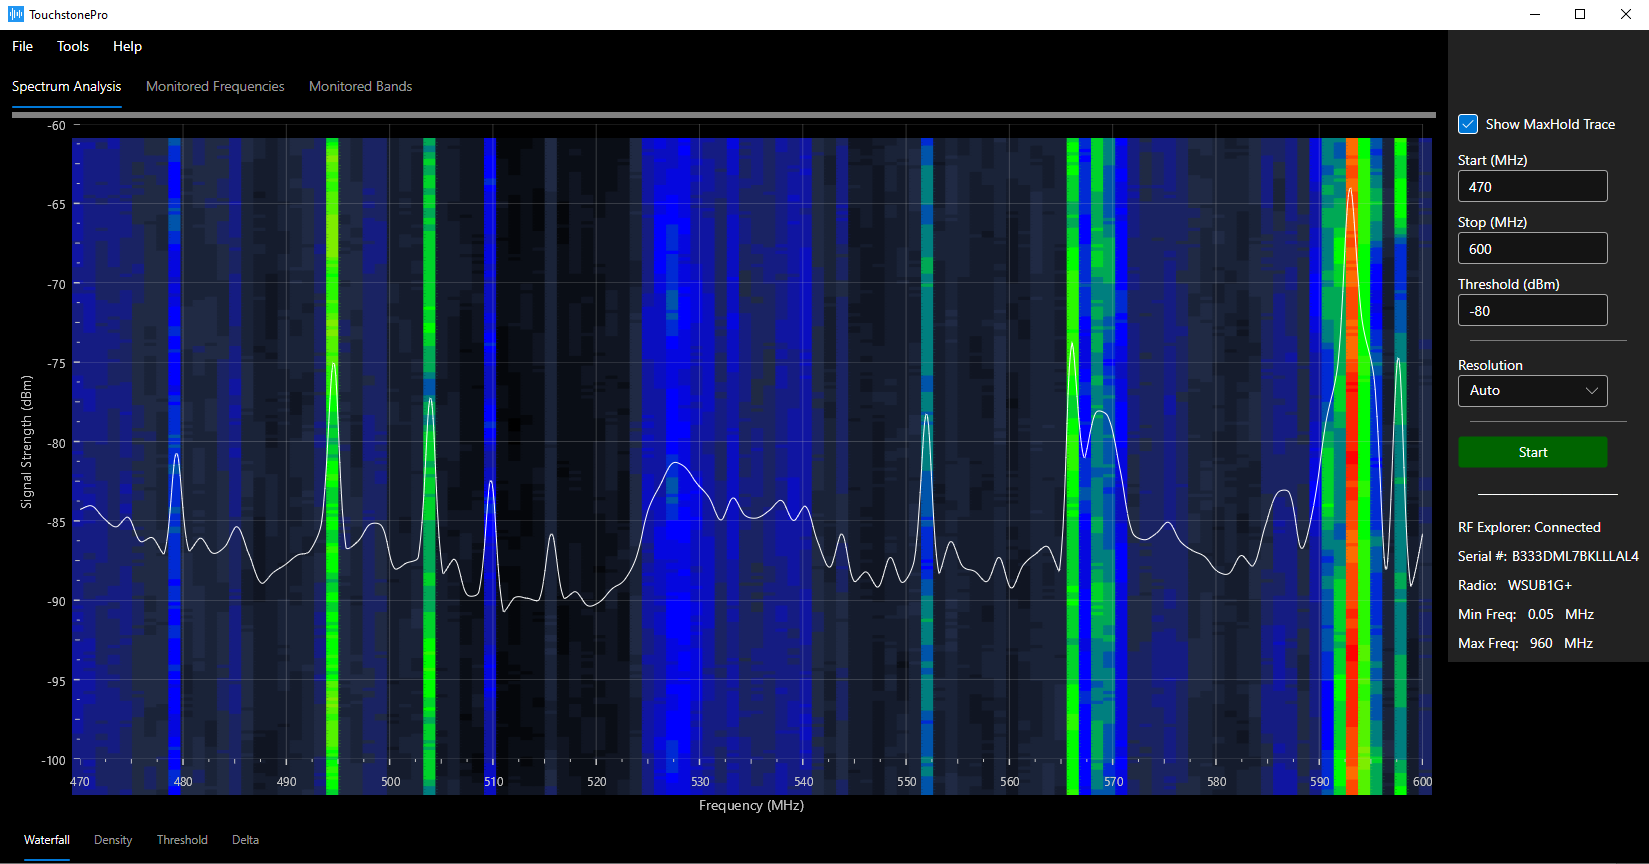
Waterfall History / Heatmap
Provides a color-based visualization of the RF level and activity over time. As signal levels for specific frequencies or frequency ranges increase and decrease, the waterfall map varies its colors. This feature provides a quick glance back into the sweep history to identify aberrations or fluctuation in frequency levels.