AP Timecourse
AP Timecourse
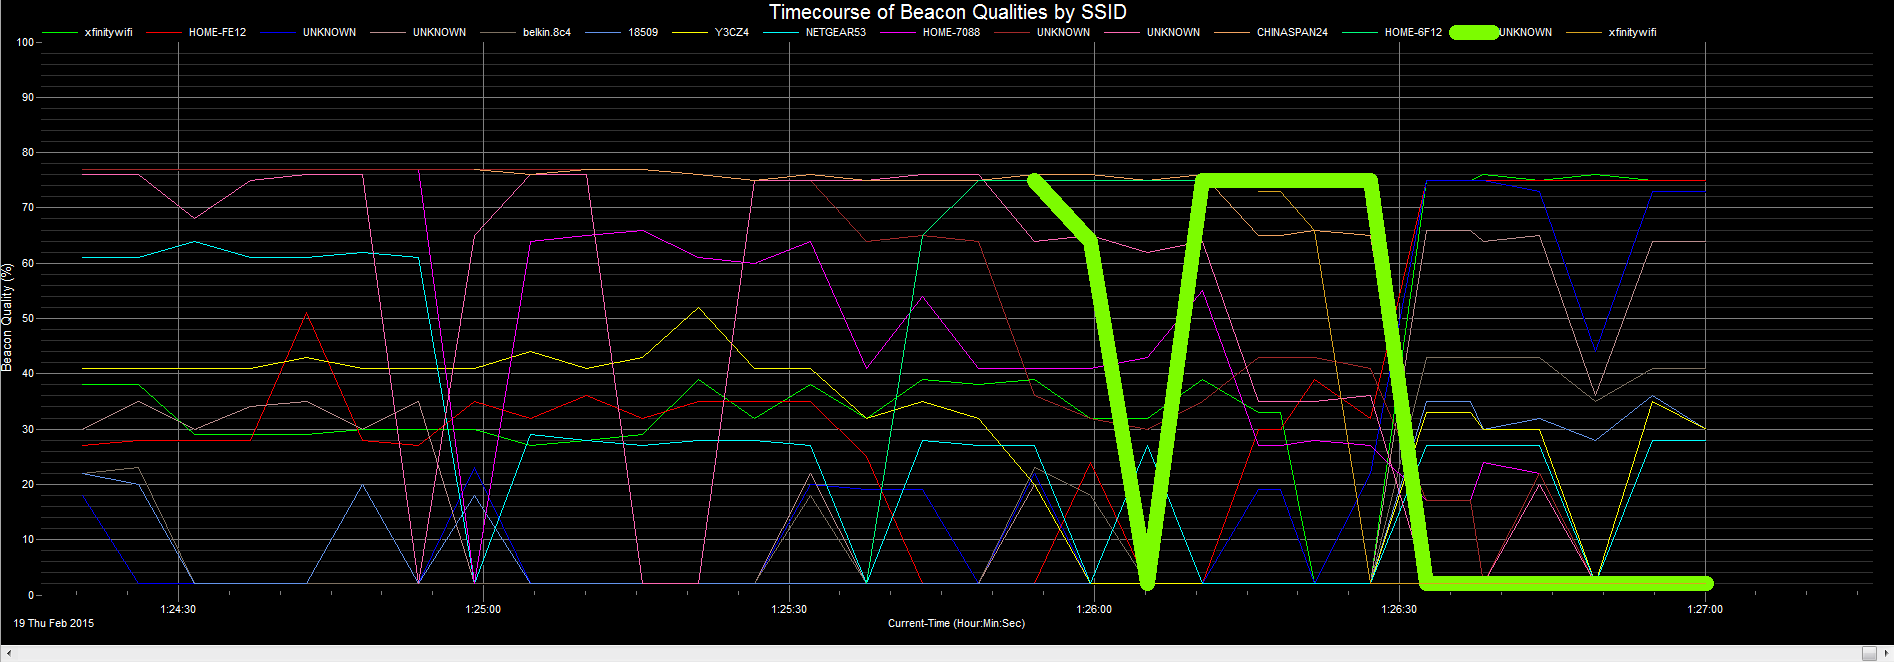
Displays the beacon strength of each access point as a function of time. The Y-axis reports the signal strength as a signal quality (0 – 100%) — where a maximum signal is assumed to be -20 dBm and the dissociation signal is -85 dBm (http://www.ces.clemson.edu/linux/dbm-rssi.shtml). We find this more intuitive than reporting a RSSI in dBm or mWatt. If you would also like to know the signal strength in dBm then this is reported in the grid above the chart.